Fund Servicers Are Racing to Stand in the Same Spot
When every administrator offers the same capabilities, the buyer stops choosing on capability.
Read Our blog
Four years of mapping prepared firms for the bad day. Very little of it looked at the busy one.
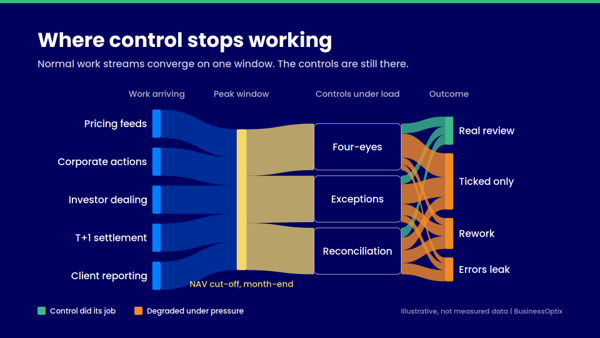 Where control stops working: normal work streams converge on one window (illustrative)
Between 2021 and March 2025 you were told to map all important business services. The impact tolerances you could sustain against the people, processes, technology, facilities and information required behind each service, and run scenario tests to find the vulnerabilities that could push you outside tolerance during a disruption.
DORA asked EU firms to do much the same for critical or important functions from January 2025. Irish firms had the Central Bank's guidance on top.
Not much of that work remains in place outside an artifact in a Sharepoint – the logic that built it buried in between the words. It will not answer a simpler question: where do our controls stop working on a normal Tuesday at month-end?
Read the FCA's expectations: Map what you need to deliver the service. Find what could fail. Test scenarios. Remediate.
The scenarios are disruptions that even a child could tell you in the car driving them to school. A data centre goes down, the internet stops working, a building explodes or even a cyber attack.
What the regime does not explicitly ask about is the day when nothing breaks, but everything is under pressure.
In asset servicing that is not a rare event. It happens every month.
Think about the points in the calendar where work piles up against a hard deadline:
At each of these points, the controls are still there on paper. The four-eyes check still exists. The reconciliation still runs. But doing that at 5:45pm before a 6pm release is being pushed from behind by the clock.
The work get done and the service is delivered. But pressure is where errors get through, rework starts, and clients complain
Three reasons, and none of them are technical.
Process is a list, not a flow. Most resilience maps rarely record volume, timing or where work queues up.
It was owned by the wrong people. It was bult at a time that operations did not have to own it yet.
It was built for a self-assessment. Static documents do not show how work behaves under load.
So the question becomes: does your servicer know where its controls degrade at month-end and could it show you?
Note that the servicer runs the same process for dozens of clients, with variations by fund type, jurisdiction and entity, and the pressure points differ for each.
Disruptions do not wait for quiet days.
The vulnerability is not just a failed system. It is the failed system plus a team with no slack and checks that were already being waved through.
The resilience programmes of the last few years answered the question regulators asked. They did not answer the one that causes most operational loss in asset servicing: what happens to control when the volume arrives?
If you want to see what a peak-day control overlay looks like on your own processes, get in touch and I will walk you through one.
Book a call with our team to learn more.